
Streaming telemetry with gNMI
This document describes how you can set up a lab environment for testing gNMI using a virtual HPE Juniper router running Junos 24.2 R1-S2.5. It shows how you can collect metrics for interfaces and CPU utilization collected with OpenNMS. This isn’t something I do every day, so I just preserve this here for my future self and the ones who want to get up to speed a bit quicker.
What you will learn
- Enable gNMI over gRPC with sensors on a HPE Juniper router
- Verify the gRPC connections and configuration
- Enable OpenNMS Horizon to subscribe to gRPC streams for sensor data
- Set up TLS on gRPC using a self-signed certificate authority
- Visualize the collected data in Grafana
Limitations
- Streaming telemetry can only be configured from the OpenNMS Core instance, see enhancement NMS-18064
- Metric labels for network interfaces are right now just resource id strings
Before you begin
You need the following environment to get a lab running:
- System with at least 2 CPU and 8 GB RAM with virtualisation capabilities for KVM running Junos and Intel VT-x enabled
- Ubuntu 24.04 (I’ve tested it with 25.04 and worked as well)
- A lab image from HPE Juniper Junos 24.2R1-S2.5
- I’ve followed the HPE Juniper instructions to deploy Junos on KVM
- gnmic command line tool for troubleshooting
- I’ve created a login on the router
adminwith passwordadmin@123 - Docker Container Engine and Docker Compose to run an OpenNMS stack as a streaming telemetry collector
- You can find a example for an OpenNMS docker compose stack with Prometheus as time series storage in the opennms-playground GitHub repository.
Lab Environment
The lab environment is using Linux system running KVM and libvirt.

Download the “vJunos-router KVM image”, “vJunos-router Meta disk script”, and the “vJunos-router libvirt XML” file.
You find the script and the XML file in the “Application Tools” section.
I have placed them in the /var/lib/libvirt/images/ directory.
I have created and empty router configuration by creating a vjunos-rtr1.conf with the following content:
system {
}
Create an config image.
bash make-config-24.2R1-S2.5.sh vjunos-rtr1.conf config.img
The files I have now are named like this:
24379464 4.0K -rw-r--r-- 1 libvirt-qemu kvm   11 Jul 16 16:49 vjunos-rtr1.conf
24379407  28K -rw-r--r-- 1 libvirt-qemu kvm 1.0M Jul 16 16:58 vjunos-rtr1-config.img
24379460 4.1G -rw-r--r-- 1 libvirt-qemu kvm 4.1G Jul 18 15:18 vjunos-rtr1-live.qcow2
49939891 4.0K -rw-r--r-- 1 libvirt-qemu kvm 2.7K Jul 16 17:36 vjunos-rtr1.xml
Edit the vjunos-rtr1.xml file and adjust the following sections.
- Line 9: For the name of your router
- Line 40: Path to the qcow2 file
- Line 45: Path to the config image
- Line 52: The interface name on your assigned to the management interface fxp for your router
|
|
Create and run the VM with virsh create vjunos-rtr1.xml.
Verify the state of the VM with virsh list
 Id   Name          State
-----------------------------
 22   vjunos-rtr1   running
You can configure the router with telnet localhost 8610.
Login as root without a password.
The user root gets to the system bash, you start the Junos CLI with cli.
Basic configuration of the Junos Router
Connect ot the router and enable SSH and configure the management interface.
telnet localhost 8610
login: root
Password:
Last login: Wed Jul 16 15:50:35 on ttyu0

--- JUNOS 24.2R1-S2.5 Kernel 64-bit  JNPR-15.0-20241031.1c96ec0_buil
root@:~ #
Start the CLI and switch into configuration mode.
root@:~ # cli
root> configure
Entering configuration mode

[edit]
root#
Enable SSH and create an admin user with password admin@123
root# set system services ssh

[edit]
root# set system login user admin authentication plain-text-password
New password:
Retype new password:

[edit]
root#
Set the IP address on the management interface
root# set interfaces fxp0 unit 0 family inet address 192.168.11.100/24
root# commit
You can test the connectivity with ping, I use the Linux system running OpenNMS with IP address 192.168.11.34.
root# run ping 192.168.11.34
💁♀️ If you need access to services outside your lab network, add a static route like this.
root# set routing-options static route 0.0.0.0/0 next-hop 192.168.11.1
root# commit
You can now login via SSH and the admin user via management address.
Enable gNMI insecure mode
I would recommend to start with a setup unencrypted. It will make your troubleshooting much easier. You can also use Wireshark to debug the gRPC connection more easily. Enable TLS just when you are confident everything is working in the last step.
Connect to your router with SSH using admin/admin@123.
ssh admin@192.168.11.100
Set up a gRPC plain text service Change into configuration mode
admin> configure
admin# set system services extension-service request-response grpc clear-text port 9339
Verify if you can connect with gnmic to the management port of the witch
gnmic --debug capabilities -a 192.168.11.100 --port 9339 -u admin -p "admin@123" --insecure
You should get a response like the one below that shows which models are supported by this device. The example output is shortened, it would blow up the page.
gNMI version: 0.7.0
supported models:
  - ietf-yang-metadata, IETF NETMOD (NETCONF Data Modeling Language) Working Group, 2016-08-05
  - junos-configuration-metadata, Juniper Networks, Inc., 2021-09-01
  - junos-conf-access-profile, Juniper Networks, Inc.,
  .
  .
  .
supported encodings:
  - JSON
  - PROTO
  - ASCII
  - JSON_IETF
Configure sensors for CPU and Interface metrics
Create an export profile for OpenNMS Horizon as a gRPC client
admin# set services analytics export-profile core local-address 192.168.11.100
admin# set services analytics export-profile core local-port 21111
admin# set services analytics export-profile core reporting-rate 10
admin# set services analytics export-profile core format gpb-gnmi
admin# set services analytics export-profile core transport grpc
Step 4: Verify your configuration
admin# show services analytics export-profile core
local-address 192.0.2.11;
local-port 21111;
reporting-rate 10;
format gpb-gnmi;
transport grpc;
Step 5: Create a CPU and interface sensor associated with the export profile
admin# set services analytics sensor cpu-sensor export-name core
admin# set services analytics sensor cpu-sensor resource /components/component/cpu/utilization
admin# set services analytics sensor interface-sensor export-name core
admin# set services analytics sensor interface-sensor resource /interfaces/interface/state/counters
Step 6: Verify configuration
root# show services analytics sensor cpu-sensor
export-name core;
resource /components/component/cpu/utilization;
root# show services analytics sensor interface-sensor
export-name core;
resource /interfaces/interface/state/counters;
Step 7: Save the configuration
root# commit
Configure Telemetryd in OpenNMS Horizon Core
If you run the stack from the opennms-playground repository, the configuration is in the repository using Prometheus as a time series storage. Grafana is also provisioned with the appropriate Prometheus data source.
The configuration in telemetryd-configuration is part of the repository. I want to highlight here the important part relevant to gNMI.
|
|
The Juniper-gNMI-Connector is responsible establishing the gRPC connection and subscribes to the stream for sensors defined in the paths attribute.
To establish the gRPC connection credentials for the admin account is used.
The frequency getting metrics is set to 10 seconds which is in nano second granularity.
TLS configuration can be overwritten with meta-data variables oc.tls.skip, oc.tls.enabled and default to tls.enabled=true and tls.skip.verify=false.
The data is parsed and mapped into the OpenNMS internal collection model in /opt/opennms/etc/telemetryd-adapters/openconfig-gnmi-telemetry.groovy script.
Provision the router
Provision the router rtr1 with the service Juniper-gNMI on the management interface 192.168.11.100.
Create a requisition file with gnmi-lab.xml.
|
|
Create a foreign source without any detectors and policies in a file gnmi-lab-fs.xml
|
|
Import the foreign source
curl -s -u admin:admin \
     -X POST \
     -H "Content-Type: application/xml" \
     -H "Accept: application/xml" \
     -d @gnmi-lab-fs.xml \
     http://localhost:8980/opennms/rest/foreignSources
Import the requisition
curl -s -u admin:admin \
     -X POST \
     -H "Content-Type: application/xml" \
     -H "Accept: application/xml" \
     -d @gnmi-lab.xml \
     http://localhost:8980/opennms/rest/requisitions
Synchronize the requisition
curl -s -u admin:admin \
     -X PUT \
     http://localhost:8980/opennms/rest/requisitions/gnmi-lab/import
You can debug telemetry daemon using the Karaf shell. For login use the same admin credentials as for the web user interface.
ssh admin@localhost -p 8101
Increase debugging to level to “debug”
admin@opennms()> log:set debug
You can follow the logs with
admin@opennms()> log:tail
Look for entries like DEBUG [AggregatorFlush-Telemetry-juniper-gnmi-queue] Generating collection set for message.
They will show you how the data is received in Telemetryd for the CPU and Interface metrics from your subscription.
|
|
Login to Grafana and you should get now access to all the metrics.
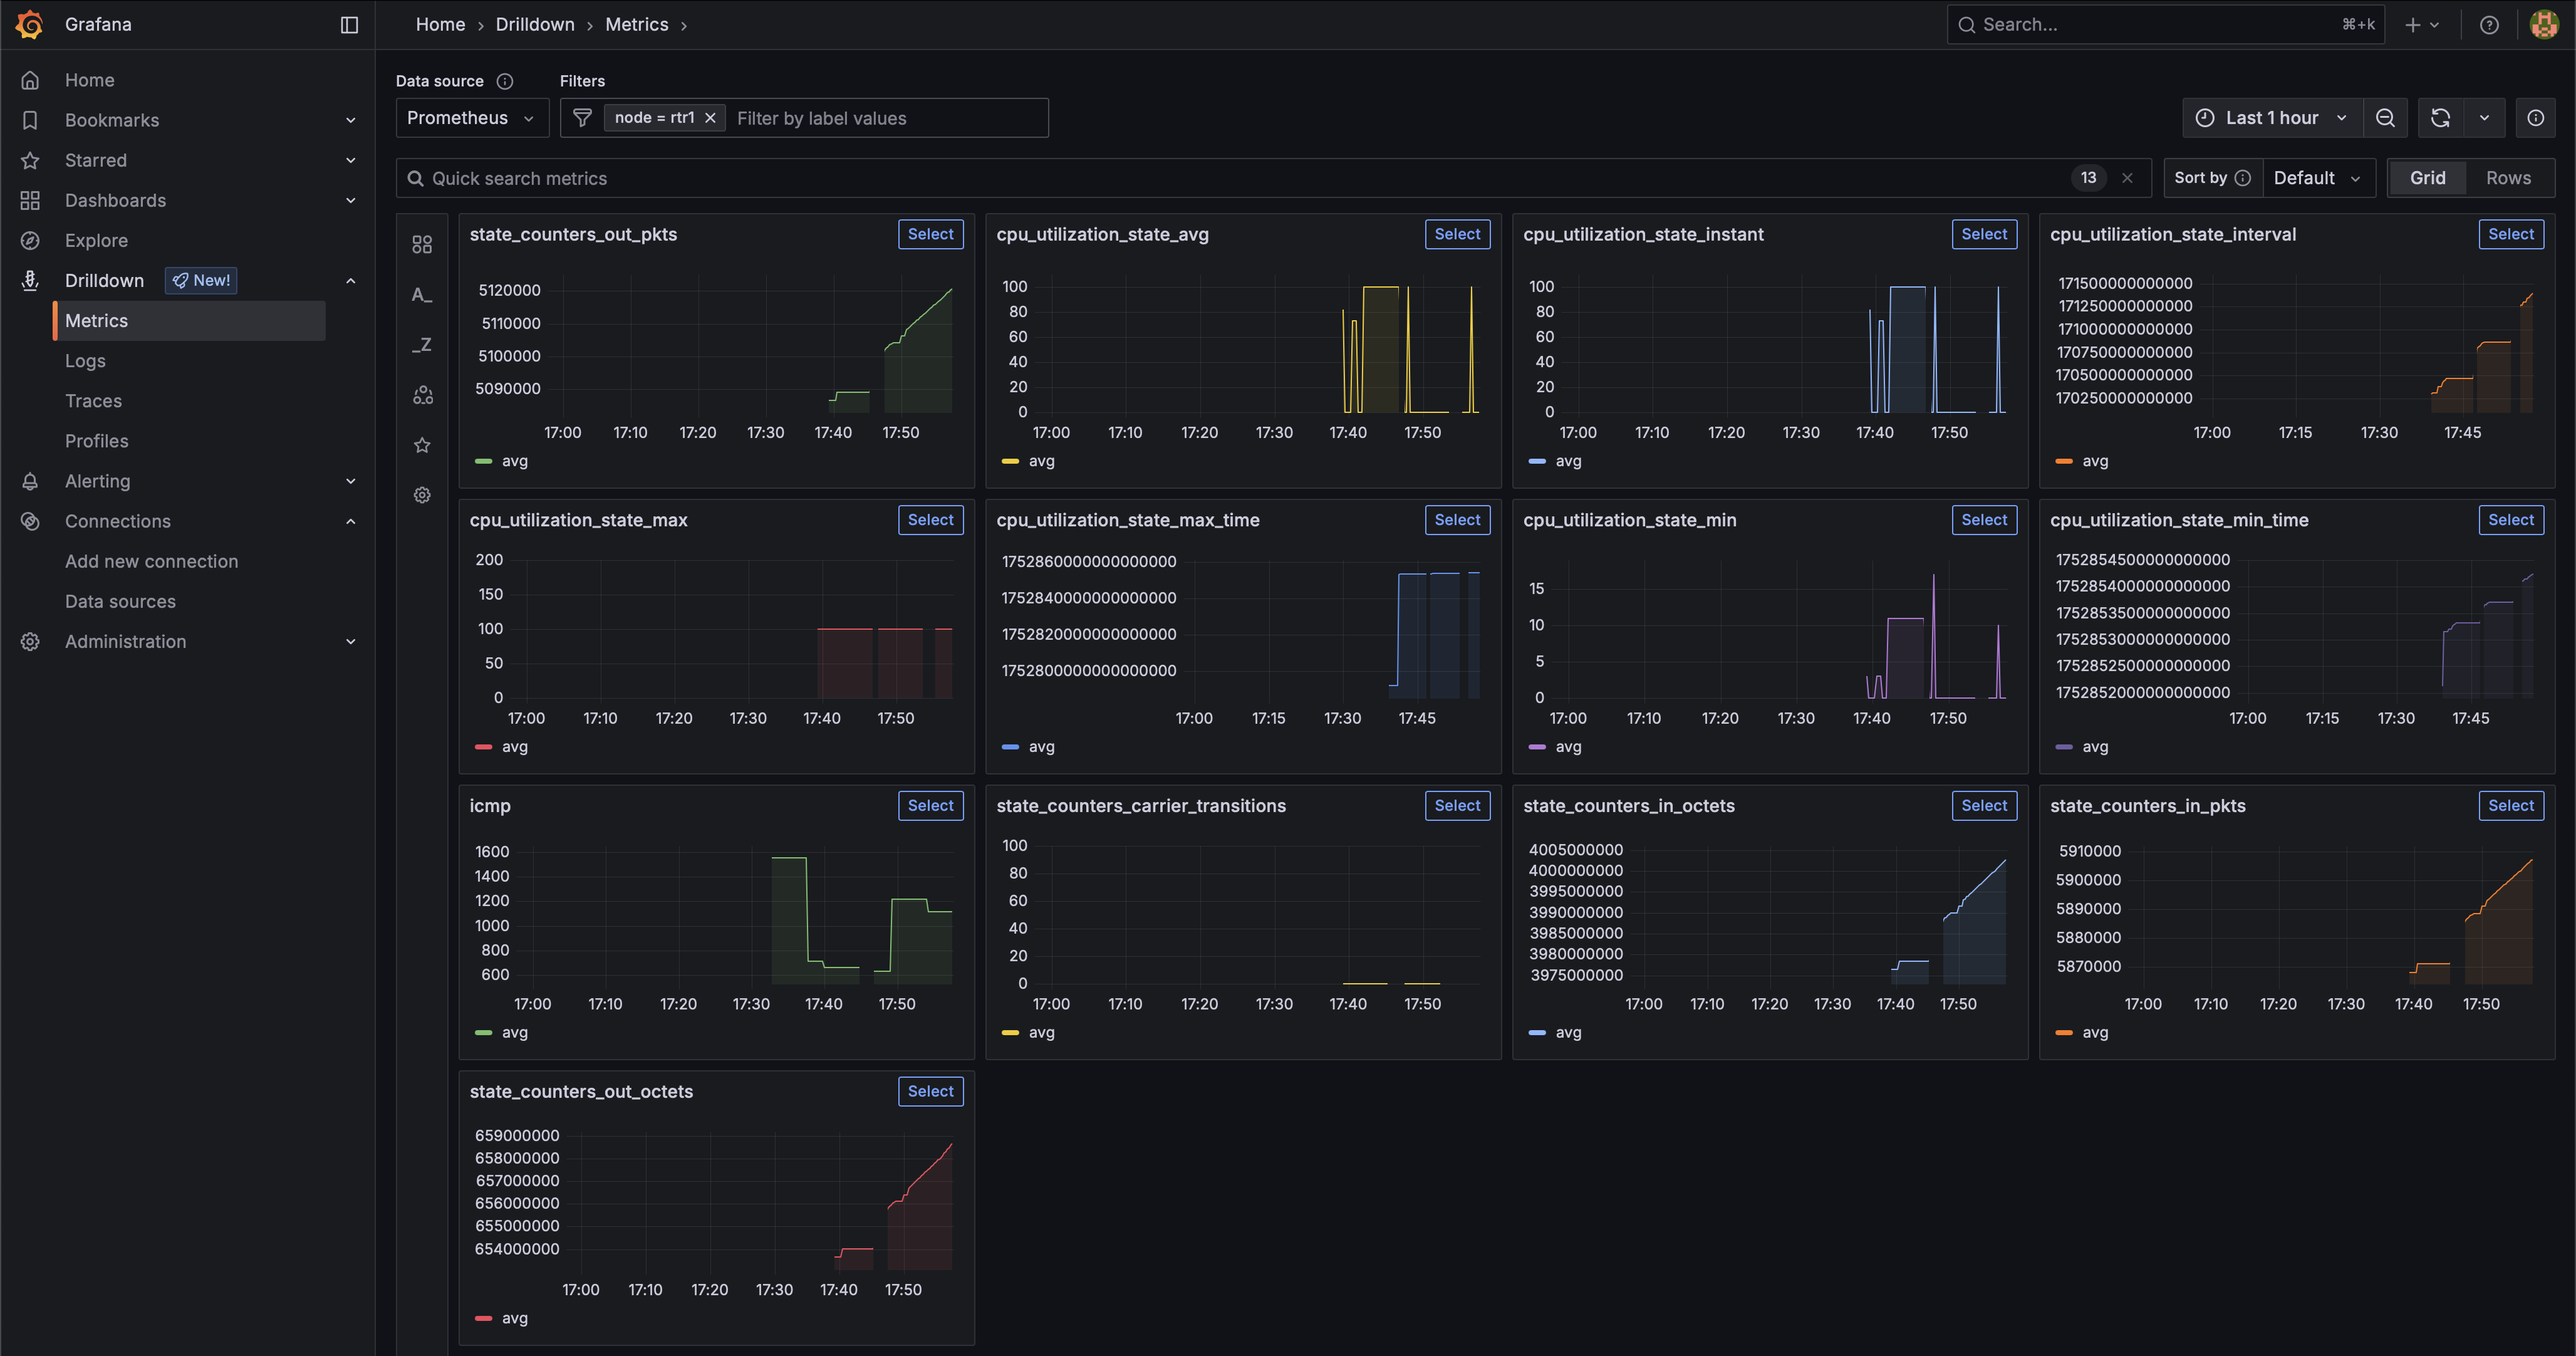
So long and gl&hf